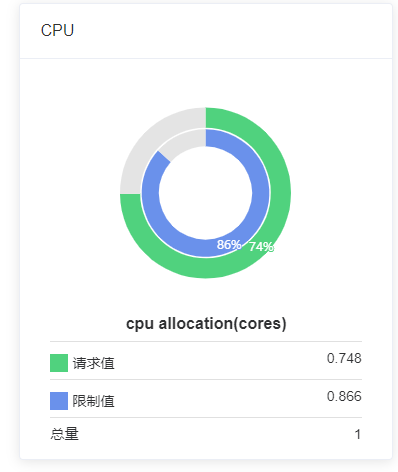
额。需求实现是一个嵌套的饼图,其实vue网上的demo上已经写好了 chart何种类型的组件但是由于项目需要,再在
他原有的PieChart上扩展显得有些麻烦,索性照猫画虎加上echarts文档搞了一嵌套饼图:
代码:
下面是模板的dom代码1
2
3
4
5
6
7
8<template>
<div :class="className" :style="{'height':height,'width':width}">
</div>
</template>
定义宽高 以及class 以及表的title等props以供组件内部调用1
2
3
4
5
6
7
8
9
10
11
12
13
14
15
16
17
18
19
20
21
22
23
24
25
26
27
28
29
30
31
32
33
34
35
36
37
38
39
40
41
42
43
44
45
46
47
48
49
50
51
52
53
54
55
56
57props: {
title: {
type: String,
default: ''
},
className: {
type: String,
default: 'chart'
},
width: {
type: String,
default: '100%'
},
height: {
type: String,
default: '300px'
},
chartName: {
type: String,
default: ''
},
chartData: {
type: Object,
default: null
},
chartColor: {
type: Array,
default: function() {
return []
}
},
hasLegend: {
type: Boolean,
default: true
},
hasTooltip: {
type: Boolean,
default: true
},
hasLabel: {
type: Boolean,
default: true
},
//一些数据字段用于计算后转换成charts数据
qqs: {
type: Number,
default: ''
},
xzs: {
type: Number,
default: null
},
zl: {
type: Number,
default: ''
}
},
下面是chart的配置数据
this.chart是data的里面定义的1
2
3
4
5
6
7
8
9
10
11
12
13
14
15
16
17
18
19
20
21
22
23
24
25
26
27
28
29
30
31
32
33
34
35
36
37
38
39
40
41
42
43
44
45
46
47
48
49
50
51
52
53
54
55
56
57
58
59
60
61
62
63
64
65
66
67
68
69
70
71
72
73
74
75
76
77
78
79
80
81
82
83
84
85
86
87
88
89
90
91
92
93
94
95const qqsPercentage = parseInt(this.qqs / this.zl * 100) + '%'
const xzsPercentage = parseInt(this.xzs / this.zl * 100) + '%'
this.chart = echarts.init(this.$el, 'macarons')
let legendObj = {
left: 'center',
bottom: '10',
data: ['实例1', '实例2', '实例3', '剩余']
}
let toolTipObj = {
trigger: 'item',
formatter: '{a} <br/>{b} : {c} ({d}%)'
}
if (this.hasLegend === 'false') {
legendObj = null
}
if (this.hasTooltip === 'false') {
toolTipObj = null
}
let xzsObj = {
hoverAnimation: false,
legendHoverLink: false,
color: ['#6A91EB', '#E4E4E4'],
name: '先限制值',
type: 'pie',
selectedMode: 'single',
radius: ['41%', '30%'],
center: ['50%', '30%'],
label: {
normal: {
position: 'inner'
}
},
labelLine: {
show: false,
normal: {
show: false
}
},
data: [
{ value: this.xzs, name: xzsPercentage },
{
value: this.zl - this.xzs, name: 'xx', label: {
normal: {
show: false
}
}
}
]
}
if (!this.xzs) {
xzsObj = null
}
const chartOptions = {
series: [
// 内
xzsObj,
// 外
{
hoverAnimation: false,
legendHoverLink: false,
color: ['#50D27E', '#E4E4E4'],
name: '访问来源',
type: 'pie',
radius: ['42%', '55%'],
center: ['50%', '30%'],
labelLine: {
show: false,
normal: {
show: false
}
},
label: {
normal: {
position: 'inner'
}
},
data: [
{ value: this.qqs, name: qqsPercentage },
{
value: this.zl - this.qqs, name: 'xx', label: {
normal: {
show: false
}
}
}
]
}
]
}
this.chart.setOption(chartOptions)
在父亲组件中使用:1
<echarts-content :qqs="cpuqqs" :xzs="cpuxzs" :zl="cpuzl" height="380px" class="grid-content" title="cpu allocation(cores)">
具体的配置意义请看echarts的文档 以及熟悉组件之间的通信方法
应该在mounted中调用方法 在method中定义方法文章中并没写全代码 贴出的也只函数内的代码段,
今天看到一句话:代码是生存,不是生活