vue中tabs切换导致一侧的echarts显示不了 (应该只要是设计tab切换就会有这个问题) 切换显示隐藏的时候渲染echarts计算宽度可能出现了问题 如图所示
如图所示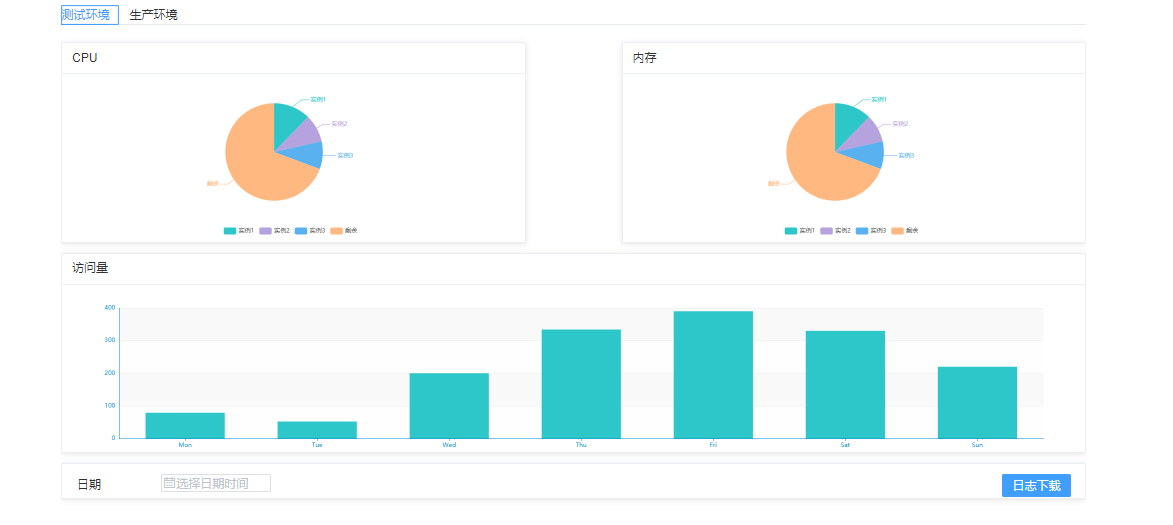
出错的图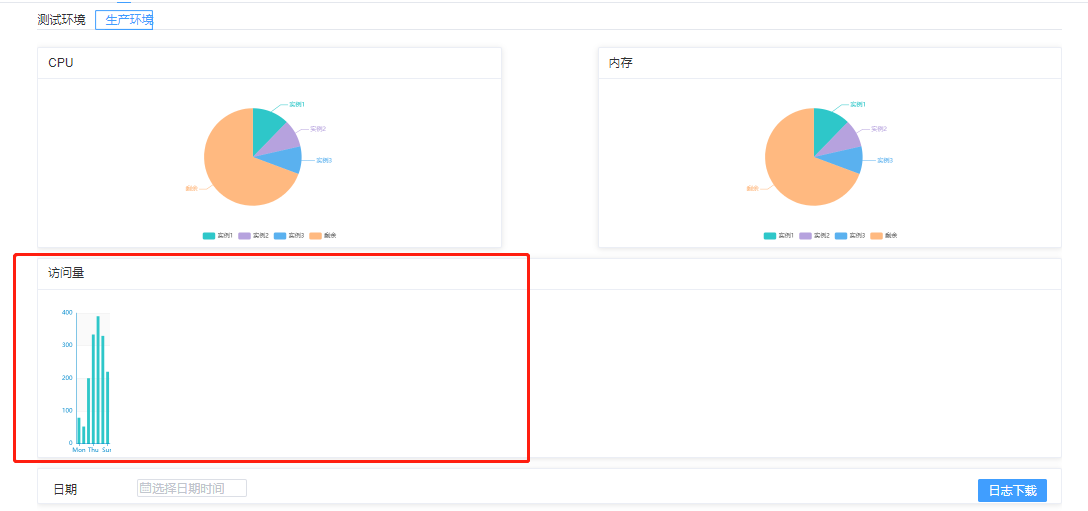
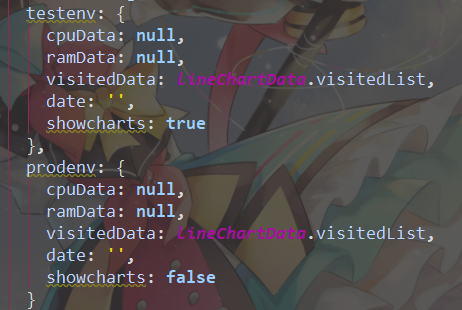
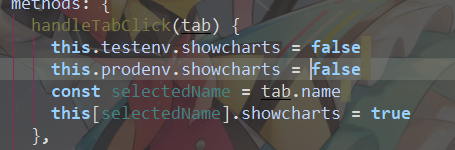
我的解决办法
通过v-if控制未显示的tab下的图标组件暂时不渲染 监听el-tabs的切换事件 到当前tab下再加载当前tab下图表的dom
解决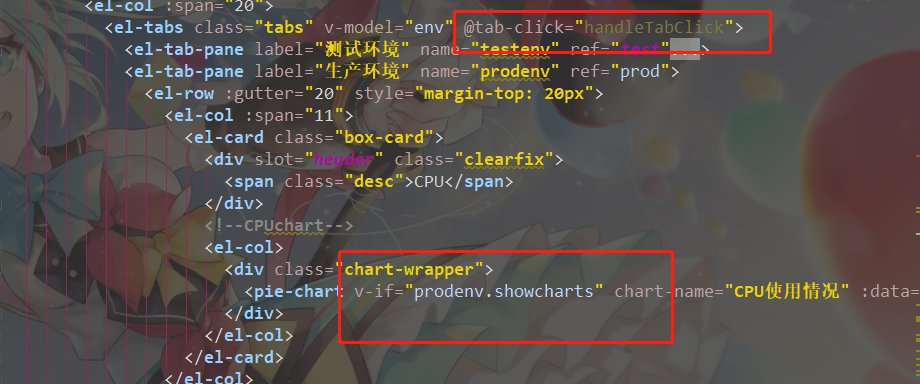

项目中使用的两种加密方式
首先项目是vue-cli 使用的两种加密方式md5和sha256 方法大致相同1
2npm install js-sha256 --save
npm install js-md5 --save
然后再main.js文件中作为全局引用 (当然也可以分文件引用)1
2
3
4
5import md5 from 'js-md5';
import sha256 from 'js-sha256';
Vue.prototype.$md5 = md5;
Vue.prototype.$sha256 = sha256;
再需要使用的文件下需要使用的方法里面使用就好了1
2
3
4created() {
console.log(this.$md5(this.loginForm.password))
console.log(this.$sha256(this.loginForm.password))
},
设置开启访问浏览统计
hexo+next 开启访问统计 给文章设置阅读量,启用不蒜子统计,仅限于文章页面显示阅读书,在首页不显示
next主题自带了不蒜子的插件功能只需在 themes/next/_config.yml1
2
3
4
5
6
7
8
9
10
11
12
13
14
15busuanzi_count:
# count values only if the other configs are false
enable: true
# custom uv span for the whole site
site_uv: true
site_uv_header: <i class="fa fa-user"></i> 访问人数
site_uv_footer: 次
# custom pv span for the whole site
site_pv: true
site_pv_header: <i class="fa fa-eye"></i> 访问总量
site_pv_footer: 次
# custom pv span for one page only
page_pv: true
page_pv_header: <i class="fa fa-file-o"></i> 浏览
page_pv_footer: 次
但是设置了发现并没有显示值 f12看一下发现源文件的引用报错了 后来查看不蒜子 的官方文档http://ibruce.info/2015/04/04/busuanzi/ 发现原来他们js插件的域名变了
于是换themes\next\layout_third-party\analytics\busuanzi-counter.swig 下js文件地址域名为1
2<script async src="//busuanzi.ibruce.info/busuanzi/2.3/busuanzi.pure.mini.js">
</script>
然后 $ hexo g -d 再生成部署下 发现ok
一个vue echart嵌套饼图的编写
额。需求实现是一个嵌套的饼图,其实vue网上的demo上已经写好了 chart何种类型的组件但是由于项目需要,再在
他原有的PieChart上扩展显得有些麻烦,索性照猫画虎加上echarts文档搞了一嵌套饼图: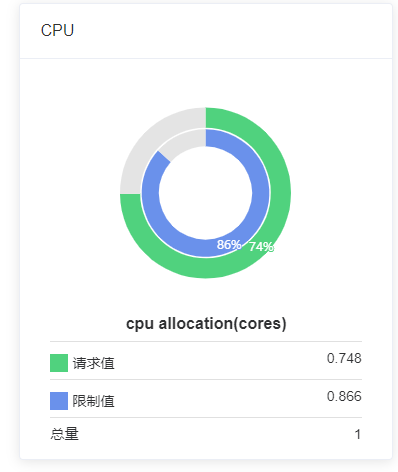
代码:
下面是模板的dom代码1
2
3
4
5
6
7
8<template>
<div :class="className" :style="{'height':height,'width':width}">
</div>
</template>
定义宽高 以及class 以及表的title等props以供组件内部调用1
2
3
4
5
6
7
8
9
10
11
12
13
14
15
16
17
18
19
20
21
22
23
24
25
26
27
28
29
30
31
32
33
34
35
36
37
38
39
40
41
42
43
44
45
46
47
48
49
50
51
52
53
54
55
56
57props: {
title: {
type: String,
default: ''
},
className: {
type: String,
default: 'chart'
},
width: {
type: String,
default: '100%'
},
height: {
type: String,
default: '300px'
},
chartName: {
type: String,
default: ''
},
chartData: {
type: Object,
default: null
},
chartColor: {
type: Array,
default: function() {
return []
}
},
hasLegend: {
type: Boolean,
default: true
},
hasTooltip: {
type: Boolean,
default: true
},
hasLabel: {
type: Boolean,
default: true
},
//一些数据字段用于计算后转换成charts数据
qqs: {
type: Number,
default: ''
},
xzs: {
type: Number,
default: null
},
zl: {
type: Number,
default: ''
}
},
下面是chart的配置数据
this.chart是data的里面定义的1
2
3
4
5
6
7
8
9
10
11
12
13
14
15
16
17
18
19
20
21
22
23
24
25
26
27
28
29
30
31
32
33
34
35
36
37
38
39
40
41
42
43
44
45
46
47
48
49
50
51
52
53
54
55
56
57
58
59
60
61
62
63
64
65
66
67
68
69
70
71
72
73
74
75
76
77
78
79
80
81
82
83
84
85
86
87
88
89
90
91
92
93
94
95const qqsPercentage = parseInt(this.qqs / this.zl * 100) + '%'
const xzsPercentage = parseInt(this.xzs / this.zl * 100) + '%'
this.chart = echarts.init(this.$el, 'macarons')
let legendObj = {
left: 'center',
bottom: '10',
data: ['实例1', '实例2', '实例3', '剩余']
}
let toolTipObj = {
trigger: 'item',
formatter: '{a} <br/>{b} : {c} ({d}%)'
}
if (this.hasLegend === 'false') {
legendObj = null
}
if (this.hasTooltip === 'false') {
toolTipObj = null
}
let xzsObj = {
hoverAnimation: false,
legendHoverLink: false,
color: ['#6A91EB', '#E4E4E4'],
name: '先限制值',
type: 'pie',
selectedMode: 'single',
radius: ['41%', '30%'],
center: ['50%', '30%'],
label: {
normal: {
position: 'inner'
}
},
labelLine: {
show: false,
normal: {
show: false
}
},
data: [
{ value: this.xzs, name: xzsPercentage },
{
value: this.zl - this.xzs, name: 'xx', label: {
normal: {
show: false
}
}
}
]
}
if (!this.xzs) {
xzsObj = null
}
const chartOptions = {
series: [
// 内
xzsObj,
// 外
{
hoverAnimation: false,
legendHoverLink: false,
color: ['#50D27E', '#E4E4E4'],
name: '访问来源',
type: 'pie',
radius: ['42%', '55%'],
center: ['50%', '30%'],
labelLine: {
show: false,
normal: {
show: false
}
},
label: {
normal: {
position: 'inner'
}
},
data: [
{ value: this.qqs, name: qqsPercentage },
{
value: this.zl - this.qqs, name: 'xx', label: {
normal: {
show: false
}
}
}
]
}
]
}
this.chart.setOption(chartOptions)
在父亲组件中使用:1
<echarts-content :qqs="cpuqqs" :xzs="cpuxzs" :zl="cpuzl" height="380px" class="grid-content" title="cpu allocation(cores)">
具体的配置意义请看echarts的文档 以及熟悉组件之间的通信方法
应该在mounted中调用方法 在method中定义方法文章中并没写全代码 贴出的也只函数内的代码段,
今天看到一句话:代码是生存,不是生活
Promise的一次复制粘贴
之前在初步了解promise的时候,大概只是了解他适用于解决回掉地狱很表面的认识。
当然现在也不是很了解,直接简单地记录一下他的一次使用记录:
此次使用了Promise.all[]来实现 调用后台返回的多来源接口 后进行数据装填
Promise.all可以将多个Promise实例包装成一个新的Promise实例。同时,成功和失败的返回值是不同的,成功的时候返回的是一个结果数组,而失败的时候则返回最先被reject失败状态的值。
贴一下代码-.-:
后台返回的参数里 又一个{key:[];}的格式 数字组里面事api调用的id 需要调用多个id的api
关于request方法的封装 也是封装返回promise对象 以便于then()调用 ps:请忽略appid的形参并没有用到-.-
lhRequest是封装好的axios实例方法就不贴了网上一搜一大堆 vue的一些demo里面也有
1
2
3
4
5
6
7
8
9
10
11
12
13
14
15
16
17
18
19
20
21
22
23
24
25
26
27
28
29
30
31
32
33
34
35
36
37
38
39
40
41
42
43
44
45
46
47
48
49
50
51// 获取多接口数据
function fetchData(arr) {
var promiseArr = []
arr.forEach(function (item, index) {
promiseArr.push(request(item, {apiid: item,bh:item.bh || '',feature:item.feature || ''}, 'post'))
})
if (promiseArr.length > 0) {
lyTool.showloading()
Promise.all(promiseArr).then(function (values) {
console.log('before');
//todo fillTable
var filledData = normalizeData(values)
fillTable(filledData)
});
}
}
function request(apiid, data = {}, method = 'get') {
return new Promise((resolve, reject) => {
_request(apiid, resolve, reject, data, method)
})
}
function _request(apiid, resolve, reject, data = {}, method = 'get') {
lhRequest.service({
url: '/serviceform/action',
method: method,
data: data
}).then(function (msg) {
if (msg.data.code == 200) {
resolve(msg.data)
}
}).catch(function (err) {
console.log(err,'1')
lhRequest.service({
url: '/remote/serviceform/action',
method: method,
data: data
}).then(function (msg){
if (msg.data.code == 200) {
resolve(msg.data)
}
}).catch(function (err) {
console.log(err)
reject();
})
})
}
以上就初步实现了多来源api调用的支持以及等待所有的api调用完成后进行数据装填 同样请求封装的方法也适用于其他情况
总而言之如果能熟练掌握promise的封装和正确使用对项目还是有很大好处 吃饭!